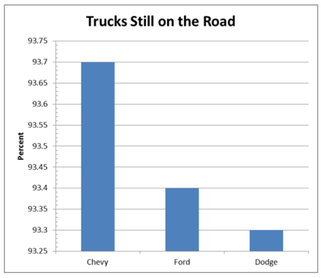
A few years ago I was watching TV and a commercial came on. It talked about how dependable Chevy trucks are. They showed trucks with tires spinning in slow-motion over rocks and mud - the Chevy truck just kept going - It seemed nearly unstoppable! Then to reinforce the point a graph flashed onto the screen. It showed a side by side comparison of how many trucks are "still on the road;" operational 10 years after they were made. That graph looked like the one you can see here on the left. It shows 3 bars, the tallest is on the left, and that is Chevy. That shows Chevy to be OBVIOUSLY better than the other two puny bars. They aren't even close. But look more closely. See what's wrong? Click here to discuss it.
 RSS Feed
